Grafana
Yggio has API-support for the JSON data source. This enables API-users to host their own Grafana and view time-series data from Yggio. Below you find instructions and help on how to set it up.
API-user
First, you need to make sure that you have created an Yggio-account. This account will be used to create the credentials used by the Grafana-app.
Client App
In order to use the API you need to create a client app. It's recommended to use the interactive API-documentation for this. The endpoint to use is POST /api/client-apps. Make sure to save the secret.
Installing Grafana
Currently we have support for versions 9.0.x.
You can find instructions on how to install Grafana here. When installing there are some custom settings required. Below you see an example of what is required to configure in order to get it up and running. More information on how to use custom configuration in Grafana is found here.
Note that this documentation is generated for this server i.e. public.yggio.net. If you are integrating Grafana on a different Yggio, please refer to the documentation that Yggio for a proper example.
It is required to change the following:
domain- to the public IP or domain name you are hosting your Grafanaroot_url- probably the same as above with http/httpssignout_redirect_url- the query paramredirect_urineeds to be changed.client_id- the client_id from when creating the client appclient_secret- the secret from when creating the client app
#### custom.ini ####

[server]
domain = grafana-test.your-domain.com
root_url = https://grafana-test.your-domain.com

[auth]
signout_redirect_url = https://public.yggio.net/auth/realms/yggio/protocol/openid-connect/logout?redirect_uri=https%3A%2F%2Fgrafana-test.your-domain.com%2Flogin
token_rotation_interval_minutes = 60

[auth.generic_oauth]
enabled = true
allow_sign_up = true
name = Yggio
client_id = grafana-test-client
client_secret = abcabcabcabc-test-test-test-cbacbacbacba
auth_url = https://public.yggio.net/auth/realms/yggio/protocol/openid-connect/auth
token_url = https://public.yggio.net/auth/realms/yggio/protocol/openid-connect/token
api_url = https://public.yggio.net/auth/realms/yggio/protocol/openid-connect/userinfo
scopes = openid, email, profile
JSON data source
Note that it's required to have admin-privileges to add and configure plugins in Grafana.
installation
Currently we have support for simpod-json-datasource plugin versions 0.6.x.
Here you can find some information on how to install plugins on Grafana.
And here are instruction on how to install JSON data source plugin specifically.
configuration
With the exception of two configurations, all of the options remains as default.
- URL:
<yggio rest-api URl>/api/grafana/iotnodes(e.g.https://public.yggio.net/api/grafana/iotnodes) - Forward OAuth Identity:
true
Start Graphing!
Once above steps are done it should be possible to create a dashboard and a panel with data from Yggio!
How to make a graph
- Choose "Time Series" as the visualization tool on the top right corner.
- Choose the metric(Iotnode) you want visualize in a graph.
- If you choose the wildcard option of your metrics (*), you will get data values from all your active Iotnodes.
How to hide "lat" and "lng" from graph.
- If your node contains data variable "latlng" it will show up on the Time series graph. See below how to hide the coordinates on the graph.
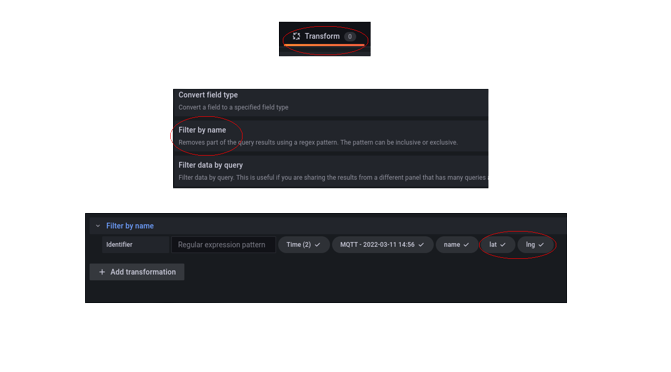
- Make sure you have chosen a metric first and foremost. (Iotnode)
- Click the "Transform" button.
- Choose "Filter by name" option from the Transform dropdown menu.
- Uncheck "lat" and "lng".
How to use map
- Choose "Geomap" as the visualization tool on the top right corner.
- Choose the metric(Iotnode) you want to visualize on the map
- Make sure you have "lat" and "lng" checked as in previous example.
- If you choose the wildcard option of your metrics (*), you will get GPS-positions from all your active Iotnodes after selecting the "merge" option in "Transform".